Interplay Between Prewetting &
|
 |
Interplay Between Prewetting &
|
 |
| We have investigated the wetting and superfluid properties of 4He on a Rubidium surface. The system completely wets at all temperatures and has a prewetting critical point at 1.96K. The superfluid transitions do not follow the standard Kosterlitz-Thouless model. The transitions are hysteretic and have nonuniversal values of the superfluid jump. In order to better understand the unusual nature of the transitions, we have developed a new type of microbalance that allows us to independently measure the normal and superfluid fractions of adsorbed films. |
 |
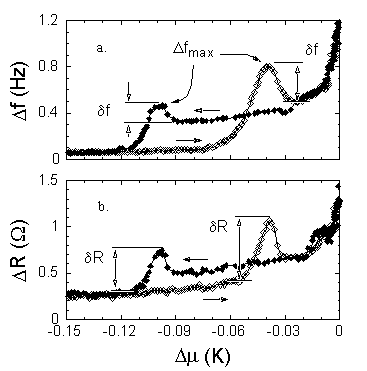
Adsorption isotherms at 1.5K of helium on rubidium surface 2 as a function of chemical potential offset from liquid-vapor coexistence, Dm. Isotherms are hysteretic and depend on whether the chemical potential is increasing or decreasing. Open diamonds are a forward isotherm in which helium is added to the experiment cell. Solid diamonds are a reverse isotherm obtained by removing helium from the cell starting from liquid -vapor coexistence. a) Frequency shift isotherm. Df=0 corresponds to vacuum. The maxima in Df indicate a prewetting thin/thick transition. Frequency change due to superfluid transition is indicated by df. b) Impedance shift DR of microbalance. The peaks in the impedance, dR, are the conventional indicators of a KT superfluid transition. |
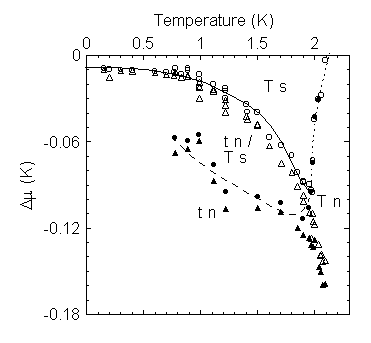
| Phase diagram for 4He films on on all three Rb substartes. Open circles are the normal to superfluid transitions in forward isotherms. Filled circles are superfluid transitions of reverse isotherms. Open and filled triangles mark the corresponding branches of the prewetting transition. Curves marking the phase boundaries are guides to the eye. The dotted line is the conventional KT transition which passes through the lambda point and the prewetting critical region. The solid curve marks the combined prewetting and superfluid onsets obtained from the forward isotherms. The dashed line marks the stability limit of the thick/thin and superfluid transitions obtained from the reverse isotherms. Regions of the phase diagram are indicated by the lettering scheme: t- thin, T- thick, s- superfluid and n- normal. |  |
 |
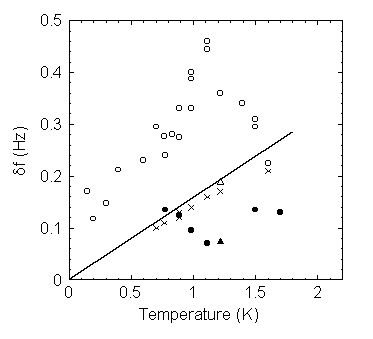
Frequency jump due to superfluid transition in 4He films as a function of temperature. Open circles are forward isotherms on surface 2, solid circles are reverse isotherms on the smae surface. Open and solid triangles are forward and reverse isotherms on surface 3, and X’s are isotherms on Au. The universal KT prediction is given by the straight line. |
Other work from our lab that will be presented at the APS March meeting: